Telegraf+InfluxDB+Grafana初探
1.Configuration information
system info1unbuntu 16.04 x86_64InfluxDB v1.1.1 install12wget https://dl.influxdata.com/influxdb/releases/influxdb_1.1.1_amd64.debsudo dpkg -i influxdb_1.1.1_amd64.debTelegraf v1.1.1 install12wget https://dl.influxdata.com/telegraf/releases/telegraf_1.1.1_amd64.debsudo dpkg -i telegraf_1.1.1_amd64.debChronograf v1.1.0~beta1 install12wget https://dl.influxdata.com/chronograf/releases/chronograf_1.1.0~beta1_amd64.debsudo dpkg -i chronograf_1.1.0~beta1_amd64.debKapacitor v1.1.1 install12wget https://dl.influxdata.com/kapacitor/releases/kapacitor_1.1.1_amd64.debsudo dpkg -i kapacitor_1.1.1_amd64.debgrafana_4.0.1 install123wget https://grafanarel.s3.amazonaws.com/builds/grafana_4.0.1-1480694114_amd64.debsudo apt-get install -y adduser libfontconfigsudo dpkg -i grafana_4.0.1-1480694114_amd64.deb
2.Telegraf 抓取本机信息
- 自动生成telegraf.conf1telegraf config > telegraf.conf
Note: Telegraf will start automatically using the default configuration when installed from a deb package.
通过deb安装的话,Telegraf默认启动的配置文件在/etc/telegraf/telegraf.conf
手动生成一个简单的配置
InfluxDB中查看抓取信息
|
|
To enable the Admin UI, edit the configuration file to set enabled = true in the [admin] section.
You must restart the process for any configuration changes to take effect.Once enabled, the Admin UI is available by default at port 8083, i.e. http://localhost:8083.
You can control the port in the InfluxDB config file using the port option in the [admin] section.
InfluxDB v1.1之前默认开启后台管理界面,直接访问:http://localhost:8083,新的版本默认关闭,开启的话需要在/etc/influxdb/influxdb.conf下[admin]选项下开启
3.Chronograf 可视化展示
|
|
访问http://localhost:10000,会看到如下界面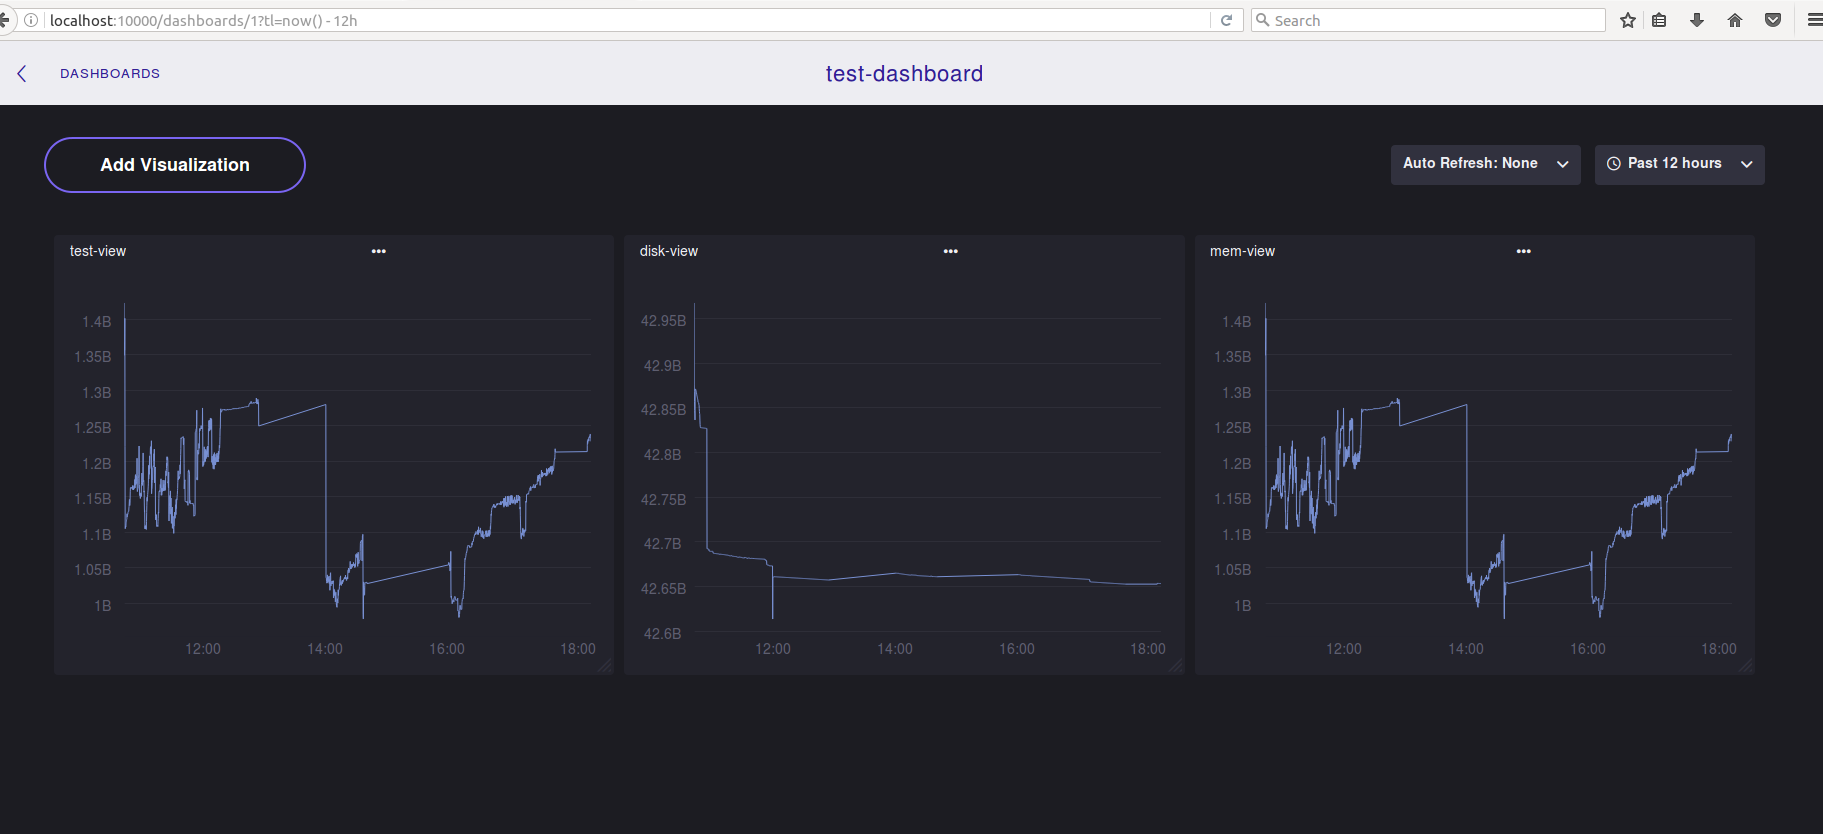
参考链接: